The home’s electrical monitoring system has been online for just about a year now, and we’ve also been watching the home’s energy consumption compared to other homes using a terrific platform from Wegowise. Even though the house has been unoccupied during this time, we’ve kept the major loads (heating, air conditioning, hot water, ventilation, and refrigerators) running as in a normal home, and so the energy usage shouldn’t be that far off what a family would experience (except for lighting and all the plug-in loads like computers and TVs).
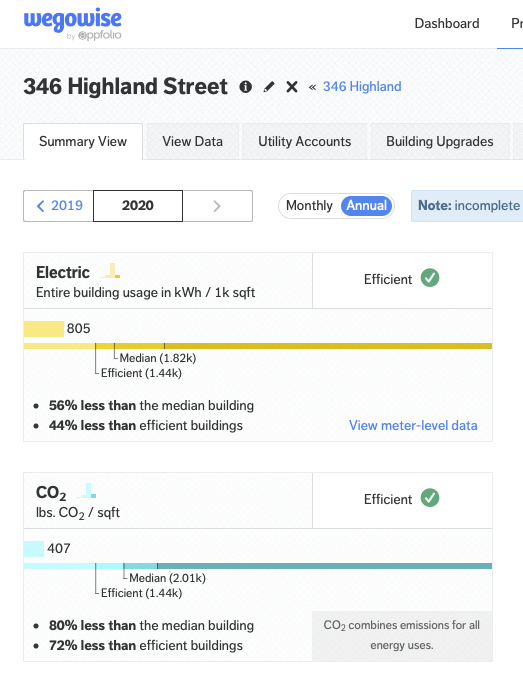
From Wegowise we can see the house is performing very well compared to a peer group of similar homes. Electric use so far in 2020 is less than half the median similar home, and CO2 production is even lower, at 80% less than a median home.
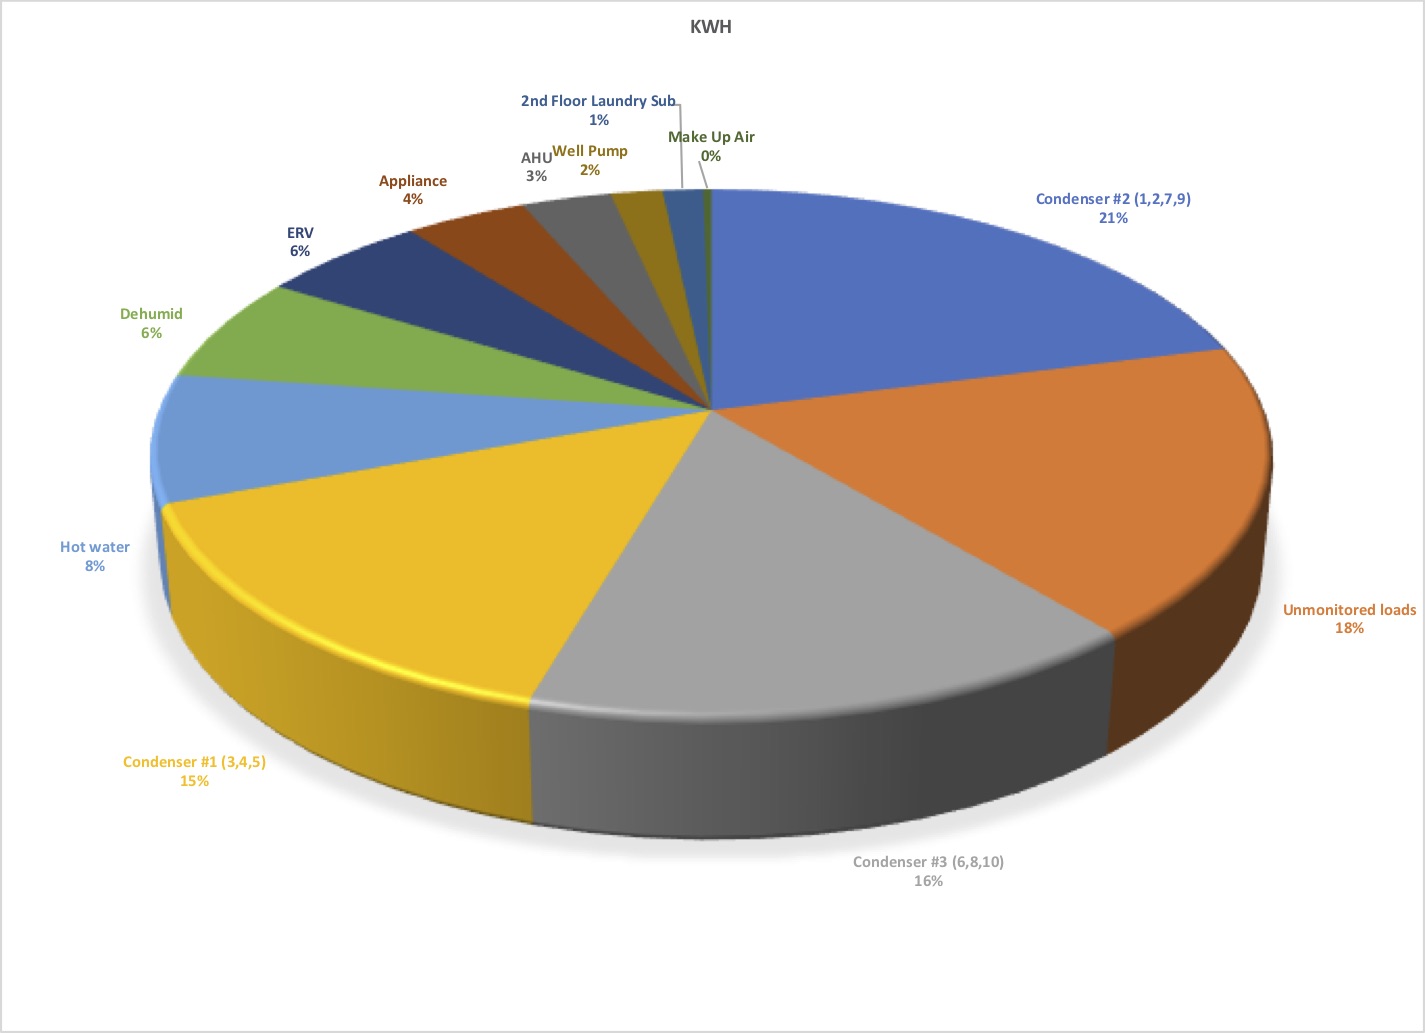
Over the past twelve months the home’s largest energy loads have been the air source heat pump compressors, which provide all the heating and cooling for the home. They accounted for about half of the home’s electric demand. The next largest loads were unmonitored loads (mostly lighting and some smaller appliances), hot water, dehumidification during the summer, and the Energy Recovery Ventilators.
Over the year the solar PV produced over 12,000 kWh of electric power, representing about 48% of the home’s overall electric usage. This has ranged from as little as 16% of the home’s energy requirements in December 2018 (cold temps, snow-covered panels, and little daylight) to over 115% in June (when the electric bill was negative!).
In all, it cost just about $3,200 to power this home for the last twelve months – and that is before considering that the solar panels produced SRECs (Solar Renewable Energy Credits) worth nearly $3,000!